This website is managed by Ultima Markets’ international entities, and it’s important to emphasise that they are not subject to regulation by the FCA in the UK. Therefore, you must understand that you will not have the FCA’s protection when investing through this website – for example:
You will not be guaranteed Negative Balance Protection
You will not be protected by FCA’s leverage restrictions
You will not have the right to settle disputes via the Financial Ombudsman Service (FOS)
You will not be protected by Financial Services Compensation Scheme (FSCS)
Any monies deposited will not be afforded the protection required under the FCA Client Assets Sourcebook. The level of protection for your funds will be determined by the regulations of the relevant local regulator.
Note: UK clients are kindly invited to visit https://www.ultima-markets.co.uk/. Ultima Markets UK expects to begin onboarding UK clients in accordance with FCA regulatory requirements in 2026.
If you would like to proceed and visit this website, you acknowledge and confirm the following:
1.The website is owned by Ultima Markets’ international entities and not by Ultima Markets UK Ltd, which is regulated by the FCA.
2.Ultima Markets Limited, or any of the Ultima Markets international entities, are neither based in the UK nor licensed by the FCA.
3.You are accessing the website at your own initiative and have not been solicited by Ultima Markets Limited in any way.
4.Investing through this website does not grant you the protections provided by the FCA.
5.Should you choose to invest through this website or with any of the international Ultima Markets entities, you will be subject to the rules and regulations of the relevant international regulatory authorities, not the FCA.
Ultima Markets wants to make it clear that we are duly licensed and authorised to offer the services and financial derivative products listed on our website. Individuals accessing this website and registering a trading account do so entirely of their own volition and without prior solicitation.
By confirming your decision to proceed with entering the website, you hereby affirm that this decision was solely initiated by you, and no solicitation has been made by any Ultima Markets entity.
Ultima Markets does not have an establishment in Singapore and does not operate from Singapore.
Ultima Markets does not provide products or services to citizens or residents of Singapore, and account applications from Singapore citizens or residents will not be accepted.
If you are a citizen or resident of Singapore, please do not open an account or use Ultima Markets’ products or services.
By selecting “Acknowledge and Continue Browsing”, you confirm that you are accessing this website on your own initiative and that your access is not the result of any direct marketing, targeted advertising, solicitation, or promotional activity by Ultima Markets.
Nothing on this website constitutes an offer, solicitation, or promotion of products or services in any jurisdiction where such activity is prohibited. You are responsible for ensuring that your access to and use of this website complies with applicable local laws and regulations.
Rising Yields & Geopolitical Friction Weigh on Global Equities
Rising Yields & Geopolitical Friction Weigh on Global Equities
Ultima Markets Daily Market Insights – 9 September 2026
Post-Holiday Sell-Off Driven by Surging Yields & Risk-Off Pressures
Global equity indices came under renewed downside pressure on Tuesday following the U.S. Labor Day holiday return. A toxic combination of surging U.S. Treasury yields, elevated crude oil prices, and escalating U.S.-Canada trade friction rattled investor confidence and dampened overall risk sentiment across global trading desks.
U.S. Yield Curve Spikes Across the Board: Treasury yields advanced sharply across all maturities. The benchmark 10-year yield touched 4.802%, while the 30-year yield reached 5.25%. Crucially, the policy-sensitive 2-year yield climbed to 4.41% as money markets recalibrated hawkish Federal Reserve rate hike probabilities ahead of key inflation prints.
Geopolitical & Energy Friction Caps Sentiment: Escalating Middle East tensions and surging energy costs continue to exert structural upward pressure on sovereign yields, raising concerns that persistent inflation could cap upside momentum for equity valuations.
All Eyes Shift to Thursday PPI & Friday CPI: Market participants are adopting a cautious stance today as the market braces for heightened volatility later in the week. Trading focus has fully transitioned toward Thursday’s U.S. Producer Price Index (PPI) and Friday’s Consumer Price Index (CPI) releases, which will serve as pivotal inputs for the Fed’s upcoming rate trajectory.
Meanwhile, markets are expected to remain in a cautious, range-bound mode in the near term.
Equity Indices Insights &Technical Outlook
With multiple headwinds converging on the market today, risk assets are likely to remain under pressure while traders scrutinize the upcoming CPI and PPI inflation prints. A resurging inflation reading could quickly sour market sentiment and weigh heavily on global equities, making it essential for traders to monitor key technical confirmation levels.
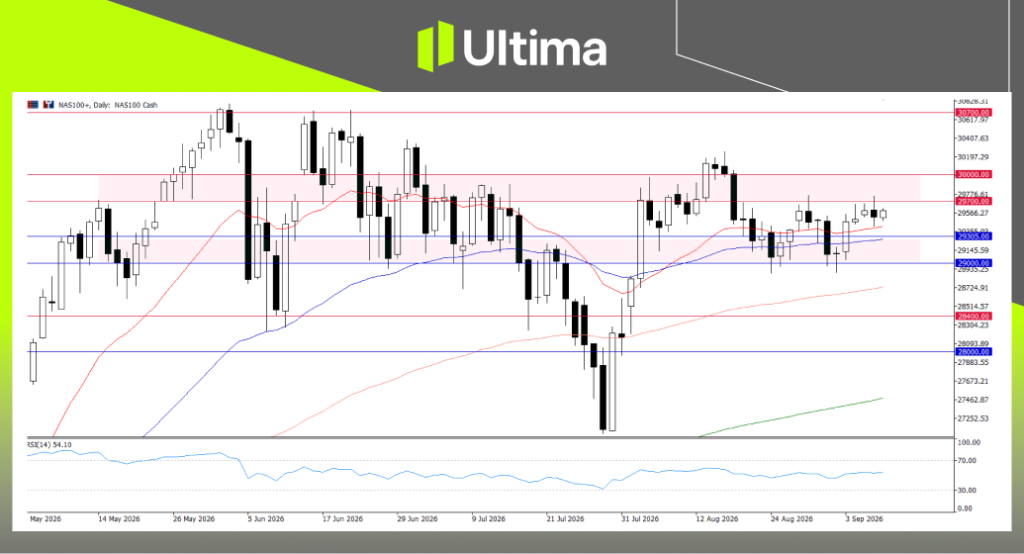
Nasdaq 100 (NAS100): Testing Key 29,000 – 29,700 Consolidation Range
Tech-heavy equities led the post-holiday decline as rising yield squeezed long-duration growth valuations.
NAS100, Daily Chart | Ultima Markets MT5
Technical Outlook: NAS100 remains constrained beneath the 30,000 psychological resistance level, consolidating within a critical technical corridor between 29,000 and 29,700.
As long as price action holds within this band, the index remains in a corrective phase. However, a decisive downside breaks below the 29,000 support floor could unlock a deeper technical pullback toward lower structural supports.
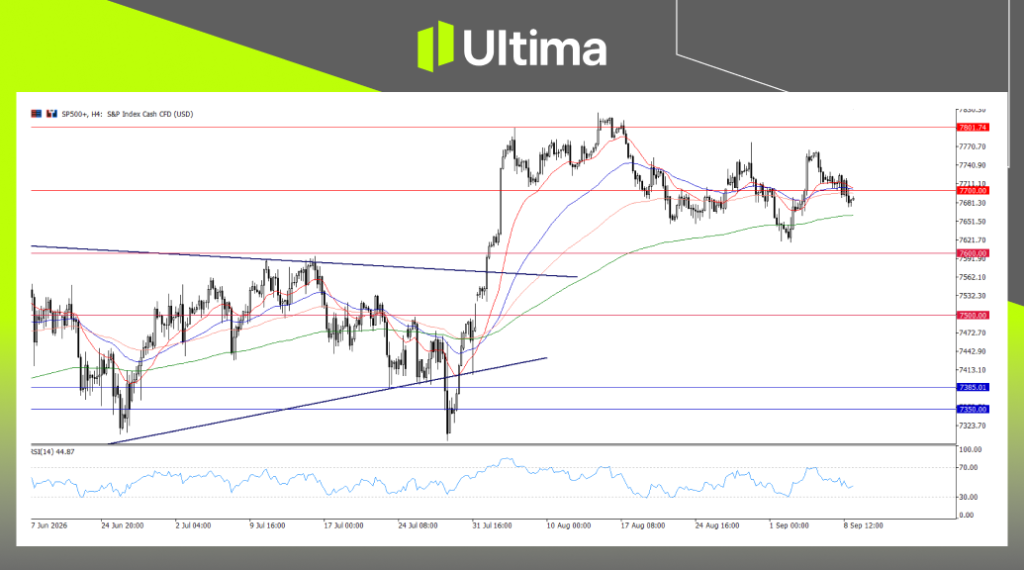
S&P 500 (SPX500): Slips Below 7,700 Floor into Range-Bound Consolidation
Broad U.S. equities experienced choppy price action as sector rotation was overshadowed by fixed-income volatility.
SP500, H4 Chart | Ultima Markets MT5
Technical Outlook: SPX500 broke beneath its 7,700 short-term floor. While the broader higher-timeframe bullish market structure remains intact, price action has transitioned into a range-bound environment.
Traders should observe whether sellers maintain persistent pressure below 7,700 or if buyers can reclaim this barrier to stabilize near-term momentum. Continued pressure below 7,700 could trigger a downside retest of 7,600, while losing 7,600 would suggest a deeper bearish correction for the benchmark index.
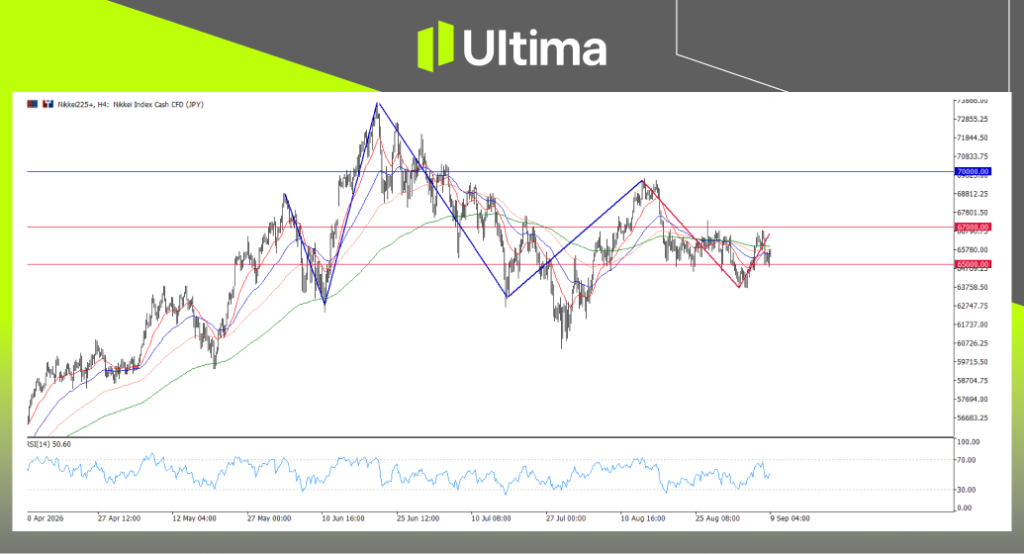
Japan Nikkei 225 (JPN225): Capped Under 20-Day & 50-Day EMAs Near 65,000
Japanese shares face dual headwinds from surging domestic yield bets and weak global risk sentiment. After pulling back from all-time highs, the index has struggled beneath the 70,000 psychological mark, with price action capped below both its 20-day and 50-day Exponential Moving Averages (EMAs) on the daily chart.
JPN225, H4 Chart | Ultima Markets MT5
Technical Outlook: In the near term, the index is currently locked in a range-bound structure near the 65,000 – 67,000 zone. A sustained breakdown below the 65,000 psychological base would signal accelerating bearish momentum and extend the corrective phase.
Market Summary & Key Highlights Today
Rising borrowing costs and looming inflation releases are keeping equity markets on the defensive today, with technical boundaries serving as primary guides ahead of U.S. PPI and CPI data later this week.
Near-term global equity indices are confronting both technical pressure and macroeconomic headwinds. While current conditions are not at their worst, a surge in upcoming U.S. inflation data could severely damage risk sentiment. The combination of rising yields, hawkish Fed expectations, Middle East escalation, and the U.S.-Canada trade dispute could trigger a sharper sell-off across equities, bringing about what traders often refer to as the “September Effect.”
What to Watch Today:
U.S. Treasury Yield Trajectory: Monitor if the 10-year yield holds above 4.80% and the 2-year stays near 4.41%, as elevated yields continue to cap equity valuations.
Nasdaq 100 Corridor at 29,000 – 29,700: Track price action within this range; a breakdown below 29,000 opens risk for a deeper corrective move.
S&P 500 Test of 7,700 & 7,600 Supports: Observe whether SPX500 can reclaim 7,700 or if continued pressure exposes the 7,600 key support base.
Nikkei 225 Range near 65,000 – 67,000: Watch for a potential breakdown below 65,000 if dynamic resistance from the 20-day and 50-day EMAs continues to cap upside attempts.
Disclaimer
Comments, news, research, analysis, price, and all information contained in the article only serve as general information for readers and do not suggest any advice. Ultima Markets has taken reasonable measures to provide up-to-date information, but cannot guarantee accuracy, and may modify without notice. Ultima Markets will not be responsible for any loss incurred due to the application of the information provided.
Thank you for visiting the Ultima Markets website. Please note that this website is intended for individuals residing in jurisdictions where access is permitted by law. Ultima and its affiliated entities do not operate in your home jurisdiction.
By clicking ‘Acknowledge’, you confirm that you are entering this website solely on your own initiative and not as a result of any specific marketing outreach. You wish to obtain information from this website based on reverse solicitation principles, in accordance with the applicable laws of your home jurisdiction.